Fukushima Floating offshore met mast data
Schematic Design of Substation
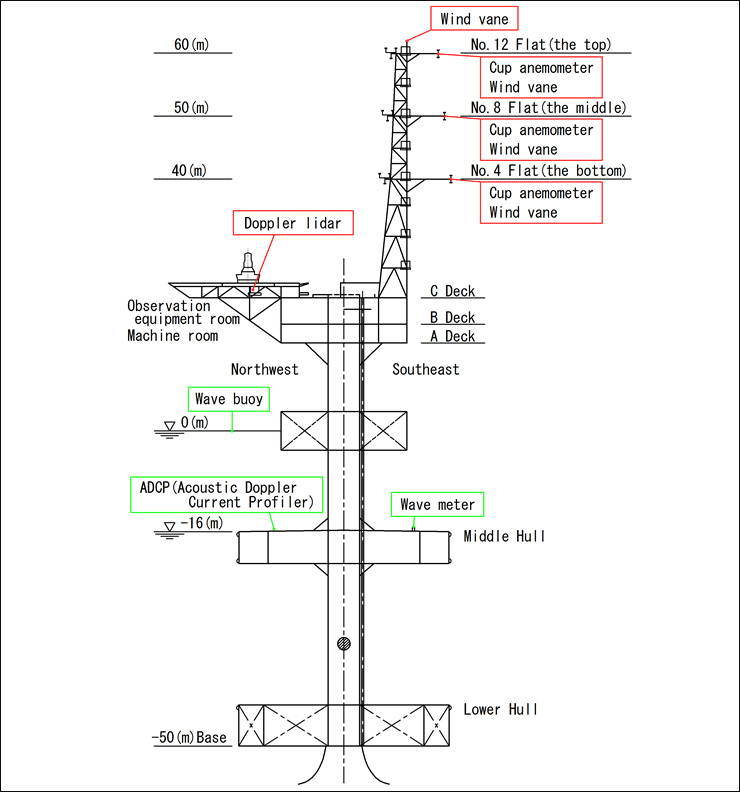
Outline of the floating offshore met mast
| Category | Fukushima floating offshore met mast |
|---|---|
| Meteorology/ Oceanography | Wind speed, Wind direction, Wave height, Wave period, Current speed |
| Water depth | 120m |
| Distance from shore | 20km |
| Tower height | 60m |
| Draft for floater | 50m |
| Installation date | 2013.11 |
| Commencement date | 2014.9 |
Measurement parameters
| Measurement device | Measurement element | Measurement location | ||
|---|---|---|---|---|
| Metrological | Wind | Cup anemometer(9) | Wind speed Wind direction Wind speed, direction |
40,50,60m 60m~310m(12 layer) |
| Wind vane(10) | ||||
| Doppler rider(1) | ||||
| Oceanography | Wave | Wave Buoy(1)* | Wave height, period** Wave height, period** |
Sea surface |
| Wave meter(1) | Sea surface | |||
| Current | Wave meter(1) | Current speed, direction |
Water depth 6.5m, 8.5m, 11.0m | |
| ADCP(1) | Water depth 5.5m, 7.6m, 11.8m |

1. Wind Data (2015~2017)
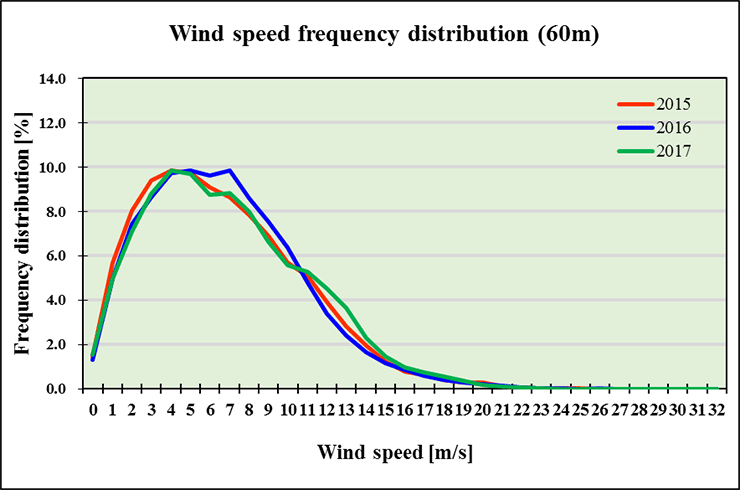
1 : Wind Speed frequency distribution
| Description | Observation year |
Jan. | Feb. | Mar. | Apr. | May. | Jun. | Jul. | Aug. | Sept. | Oct. | Nov. | Dec. | year |
|---|---|---|---|---|---|---|---|---|---|---|---|---|---|---|
| Weibull distribution Shape parameter(k) |
2015 | 1.85 | 1.67 | 1.9 | 2.05 | 2.1 | 2.46 | 1.47 | 2.02 | 1.93 | 1.55 | 2.29 | 2.07 | 1.88 |
| 2016 | 2.06 | 2.08 | 1.96 | 2.08 | 2.02 | 1.88 | 2.42 | 1.67 | 1.79 | 2.05 | 2.34 | 2.06 | 1.96 | |
| 2017 | 2.56 | 2.23 | 1.87 | 1.96 | 2.16 | 1.63 | 2.12 | 1.94 | 1.47 | 1.98 | 1.98 | 1.71 | 1.91 | |
| Weibull distribution Shape parameter(c) |
2015 | 9.07 | 8.71 | 8.55 | 9.15 | 8.54 | 7.95 | 6.24 | 7.25 | 6.92 | 8.08 | 8.29 | 8.38 | 8.12 |
| 2016 | 8.62 | 8.67 | 8.24 | 9.68 | 9.19 | 7.36 | 6.69 | 8.13 | 6.7 | 7.72 | 8.13 | 9.46 | 8.25 | |
| 2017 | 10.53 | 10.60 | 8.04 | 9.14 | 8.59 | 7.01 | 8.30 | 6.91 | 7.00 | 7.89 | 8.01 | 8.53 | 8.42 |
Wind speed frequency distribution(60m)
Comment
Wind speed frequency shows a similar distribution in three years.
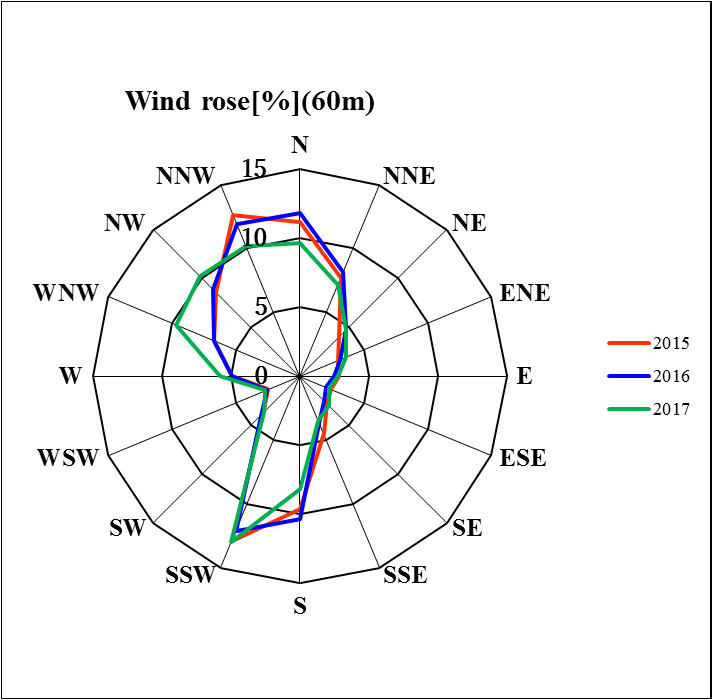
2:Wind rose
| Obs. year | Wind rose[%](60m) | |||||||||||||||
|---|---|---|---|---|---|---|---|---|---|---|---|---|---|---|---|---|
| N | NNE | NE | ENE | E | ESE | SE | SSE | S | SSW | SW | WSW | W | WNW | NW | NNW | |
| 2015 | 11.2 | 7.7 | 4.0 | 3.0 | 2.9 | 2.5 | 2.8 | 4.5 | 9.6 | 12.9 | 3.8 | 2.5 | 4.9 | 6.8 | 8.6 | 12.6 |
| 2016 | 11.8 | 8.2 | 4.7 | 3.1 | 2.4 | 2.0 | 2.5 | 3.7 | 10.3 | 12.1 | 4.0 | 2.6 | 4.9 | 6.7 | 8.9 | 11.9 |
| 2017 | 9.6 | 7.2 | 4.7 | 3.6 | 2.8 | 2.3 | 3.0 | 3.5 | 8.2 | 13.0 | 3.6 | 2.7 | 5.8 | 9.7 | 10.2 | 10.2 |
Wind rose(H=60m)
Comment
The prevailing wind direction at 60m height is Northerly and Southerly. In 2017, unlike other years, one of the prevailing wind direction is West North Westerly.
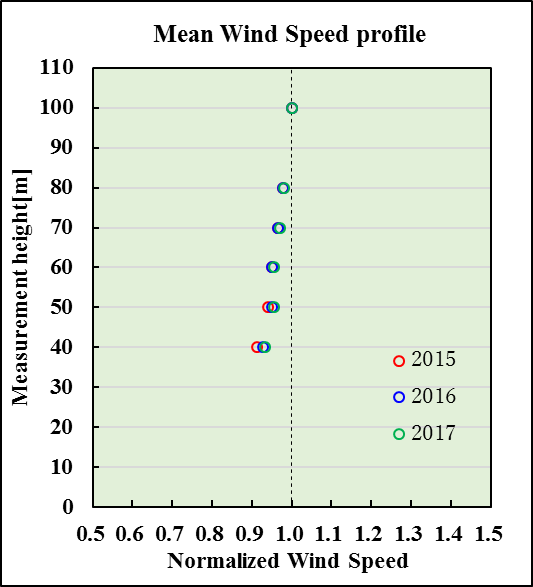
3:Mean wind speed profile
| year | α |
|---|---|
| 2015 | 0.096 |
| 2016 | 0.084 |
| 2017 | 0.075 |
Shear exponent
Commentary
The mean wind speed profile normalized by the mean wind speed at 100m above sea level has the shear exponent of less than 0.1.
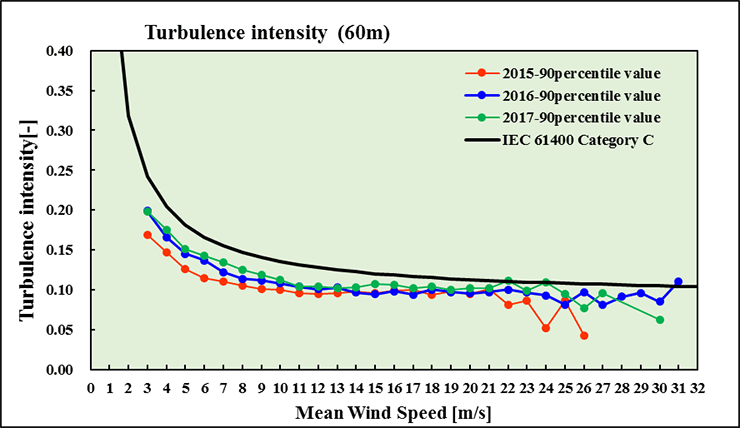
4:Turbulence intensity
Comment
The turbulence intensity is lower than IEC 61400-1 Category C in any year except for the wind speed of 30m/s or higher.
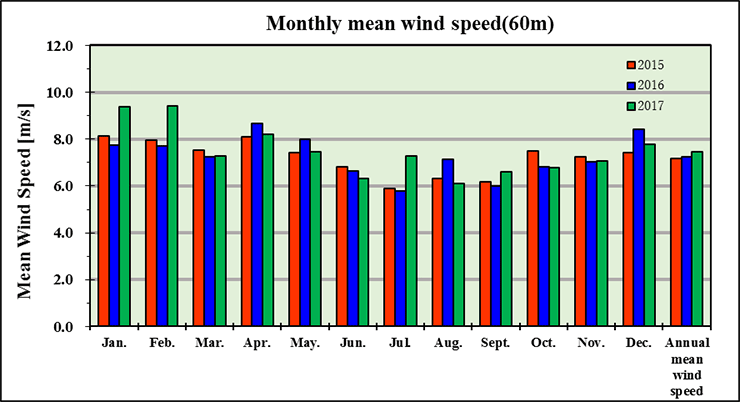
5:Monthly mean wind speed and data availability
| Description | Measurement height |
Observation year |
Jan. | Feb. | Mar. | Apr. | May. | Jun. | Jul. | Aug. | Sept. | Oct. | Nov. | Dec. | Annual mean wind speed |
|
|---|---|---|---|---|---|---|---|---|---|---|---|---|---|---|---|---|
| Mean wind speed[m/s] | 60m | 2015 | 8.1 | 8.0 | 7.5 | 8.1 | 7.4 | 6.8 | 5.9 | 6.3 | 6.2 | 7.5 | 7.2 | 7.4 | 7.2 | |
| 2016 | 7.7 | 7.7 | 7.3 | 8.7 | 8.0 | 6.6 | 5.8 | 7.1 | 6.0 | 6.8 | 7.0 | 8.4 | 7.2 | |||
| 2017 | 9.4 | 9.4 | 7.3 | 8.2 | 7.5 | 6.3 | 7.3 | 6.1 | 6.6 | 6.8 | 7.1 | 7.8 | 7.5 | |||
| Data availability[%] | 2015 | 85.7 | 84.4 | 100.0 | 100.0 | 100.0 | 100.0 | 100.0 | 100.0 | 100.0 | 100.0 | 100.0 | 100.0 | 97.5 | ||
| 2016 | 100.0 | 88.2 | 100.0 | 93.5 | 100.0 | 100.0 | 98.7 | 100.0 | 100.0 | 100.0 | 100.0 | 100.0 | 98.4 | |||
| 2017 | 100.0 | 90.2 | 97.5 | 100.0 | 100.0 | 100.0 | 99.6 | 99.7 | 100.0 | 100.0 | 90.1 | 100.0 | 98.1 | |||
Monthly mean wind speed and data availability
Comment
The annual mean wind speed is between 7.2m/s and 7.5m/s. The monthly mean value in January is 7.7m/s in 2016 and 9.4m/s in 2017. There is a big difference of 1.7m/s between two value in comparison with other months.
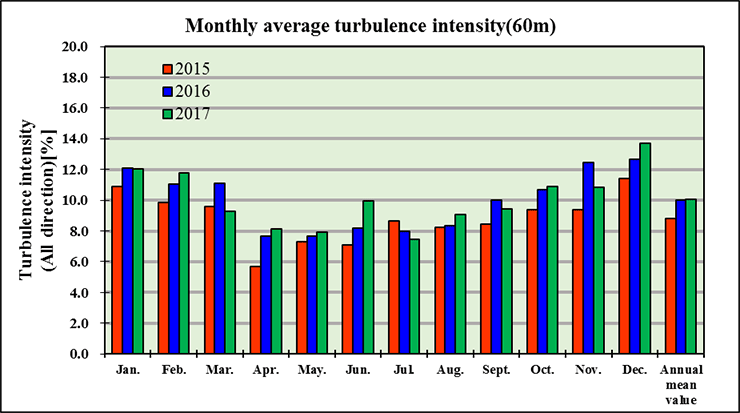
6:Monthly average turbulence intensity
| Description | Measurement height |
Observation Year |
Jan. | Feb. | Mar. | Apr. | May. | Jun. | Jul. | Aug. | Sept. | Oct. | Nov. | Dec. | Annual mean value |
|
|---|---|---|---|---|---|---|---|---|---|---|---|---|---|---|---|---|
| Mean turbulence intensity[%] |
60m [All direction] |
2015 | 10.9 | 9.9 | 9.6 | 5.7 | 7.3 | 7.1 | 8.7 | 8.2 | 8.4 | 9.4 | 9.4 | 11.4 | 8.8 | |
| 2016 | 12.1 | 11.0 | 11.1 | 7.7 | 7.7 | 8.2 | 8.0 | 8.4 | 10.0 | 10.7 | 12.4 | 12.7 | 10.0 | |||
| 2017 | 12.1 | 11.8 | 9.3 | 8.1 | 7.9 | 10.0 | 7.5 | 9.1 | 9.4 | 10.9 | 10.9 | 13.7 | 10.1 | |||
Monthly average turbulence intensity (H=60m)
Comment
Annual average turbulence intensity is between 8.8% to 10.1%. Annual average turbulence intensity is about 10% in 2016 and 2017 and 8.8% in 2015 which is smaller than the other years.
2. Wave Data (2015~2017)
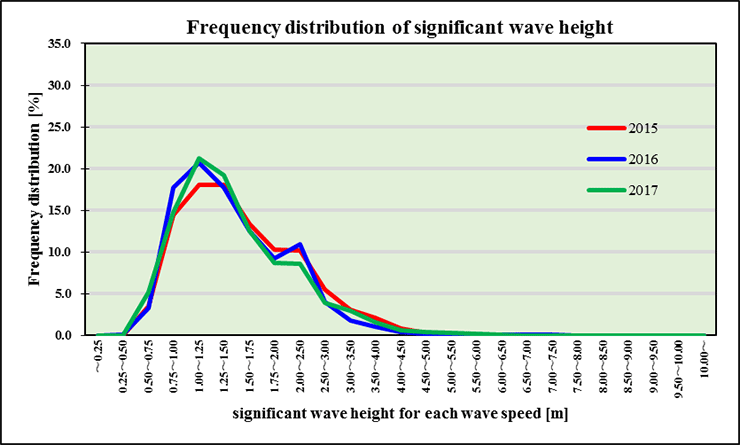
1:Frequency distribution of significant wave height
Comment
The maximum significant wave height frequency is between 1.00m and 1.25m, and there is no difference depending on the year.
2:Wave rose
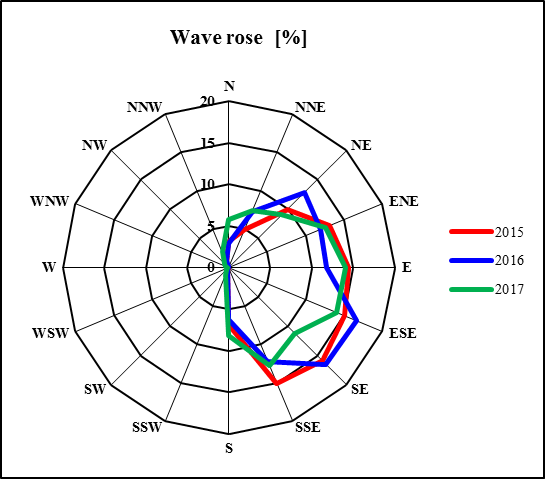
| Description | Year | N | NNE | NE | ENE | E | ESE | SE | SSE | S | SSW | SW | WSW | W | WNW | NW | NNW |
|---|---|---|---|---|---|---|---|---|---|---|---|---|---|---|---|---|---|
| Frequency distribution [%] |
2015 | 3.1 | 5.0 | 9.9 | 13.1 | 14.4 | 15.0 | 15.9 | 15.1 | 6.9 | 0.4 | 0.0 | 0.1 | 0.1 | 0.1 | 0.2 | 0.7 |
| 2016 | 2.9 | 7.3 | 12.8 | 11.9 | 11.7 | 16.6 | 16.4 | 12.3 | 6.2 | 0.4 | 0.2 | 0.1 | 0.0 | 0.0 | 0.1 | 0.9 | |
| 2017 | 5.8 | 7.5 | 9.0 | 12.6 | 14.1 | 14.1 | 11.2 | 12.8 | 8.1 | 1.0 | 0.3 | 0.1 | 0.2 | 0.4 | 0.8 | 2.0 |
Wave rose
Comment
The prevailing wave direction is Easterly and SSE which agree with the fact that the wave comes from the Pacific Ocean because the coast is located on the west side of the project.
3:Frequency distribution of the significant wave period
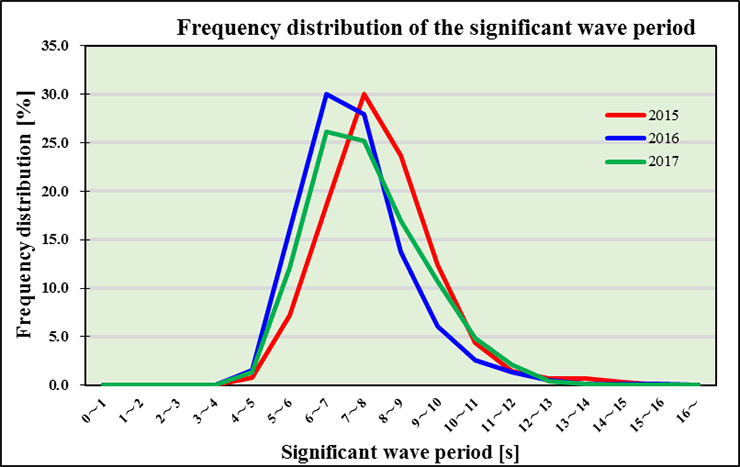
Comment
The maximum significant wave period frequency in 2015 is between 7 sec and 8 sec., and that in 2016 and 2017 is between 6 sec. and 7 sec.. The significant wave period frequency distribution varies widely from year to year.
4:Joint probability distribution of wave height and wave period
Table 1 Joint probability distribution of wave height and wave period (2015)
| 0.0~ | 1.0~ | 2.0~ | 3.0~ | 4.0~ | 5.0~ | 6.0~ | 7.0~ | 8.0~ | 9.0~ | 10.0~ | 11.0~ | 12.0~ | 13.0~ | 14.0~ | 15.0~ | 16.0~ | appearance frequency |
Frequency distribution [%] |
|
| 10.00~ | 0 | 0.0 | |||||||||||||||||
| 9.50~10.00 | 0 | 0.0 | |||||||||||||||||
| 9.00~9.50 | 0 | 0.0 | |||||||||||||||||
| 8.50~9.00 | 0 | 0.0 | |||||||||||||||||
| 8.00~8.50 | 0 | 0.0 | |||||||||||||||||
| 7.50~8.00 | 0 | 0.0 | |||||||||||||||||
| 7.00~7.50 | 0 | 0.0 | |||||||||||||||||
| 6.50~7.00 | 0.0 | 0.0 | |||||||||||||||||
| 6.00~6.50 | 1 | 3 | 2 | 2 | 8 | 0.1 | |||||||||||||
| 5.50~6.00 | 1 | 7 | 1 | 9 | 0.1 | ||||||||||||||
| 5.00~5.50 | 2 | 6 | 1 | 1 | 5 | 15 | 0.2 | ||||||||||||
| 4.50~5.00 | 5 | 3 | 1 | 1 | 6 | 4 | 1 | 21 | 0.2 | ||||||||||
| 4.00~4.50 | 1 | 8 | 35 | 8 | 6 | 4 | 6 | 7 | 75 | 0.9 | |||||||||
| 3.50~4.00 | 6 | 46 | 67 | 31 | 17 | 8 | 2 | 6 | 183 | 2.1 | |||||||||
| 3.00~3.50 | 1 | 19 | 71 | 113 | 31 | 14 | 1 | 13 | 8 | 271 | 3.1 | ||||||||
| 2.50~3.00 | 1 | 33 | 94 | 172 | 127 | 35 | 4 | 4 | 12 | 482 | 5.5 | ||||||||
| 2.00~2.50 | 16 | 144 | 283 | 260 | 77 | 61 | 21 | 13 | 12 | 887 | 10.1 | ||||||||
| 1.75~2.00 | 31 | 122 | 336 | 281 | 80 | 36 | 5 | 7 | 2 | 900 | 10.3 | ||||||||
| 1.50~1.75 | 96 | 229 | 362 | 266 | 141 | 63 | 8 | 9 | 1174 | 13.4 | |||||||||
| 1.25~1.50 | 12 | 125 | 319 | 483 | 321 | 205 | 82 | 32 | 5 | 1584 | 18.1 | ||||||||
| 1.00~1.25 | 24 | 193 | 372 | 534 | 300 | 132 | 20 | 6 | 1581 | 18.0 | |||||||||
| 0.75~1.00 | 26 | 125 | 314 | 386 | 302 | 104 | 6 | 1263 | 14.4 | ||||||||||
| 0.50~0.75 | 3 | 45 | 88 | 125 | 44 | 1 | 306 | 3.5 | |||||||||||
| 0.25~0.50 | 1 | 1 | 0.0 | ||||||||||||||||
| ~0.25 | 0 | 0.0 | |||||||||||||||||
| appearance frequency | 0 | 0 | 0 | 0 | 65 | 632 | 1622 | 2630 | 2071 | 1088 | 384 | 123 | 56 | 60 | 28 | 1 | 0 | 8760 | 100.0 |
| Frequency distribution[%] | 0.0 | 0.0 | 0.0 | 0.0 | 0.7 | 7.2 | 18.5 | 30.0 | 23.6 | 12.4 | 4.4 | 1.4 | 0.6 | 0.7 | 0.3 | 0.0 | 0.0 | 100.0 |
Table 2 Joint probability distribution of wave height and wave period(2016)
| 0.0~ | 1.0~ | 2.0~ | 3.0~ | 4.0~ | 5.0~ | 6.0~ | 7.0~ | 8.0~ | 9.0~ | 10.0~ | 11.0~ | 12.0~ | 13.0~ | 14.0~ | 15.0~ | 16.0~ | appearance frequency |
Frequency distribution [%] |
|
| 10.00~ | 0 | 0.0 | |||||||||||||||||
| 9.50~10.00 | 0 | 0.0 | |||||||||||||||||
| 9.00~9.50 | 0 | 0.0 | |||||||||||||||||
| 8.50~9.00 | 0 | 0.0 | |||||||||||||||||
| 8.00~8.50 | 1 | 1 | 0.0 | ||||||||||||||||
| 7.50~8.00 | 1 | 1 | 0.0 | ||||||||||||||||
| 7.00~7.50 | 1 | 1 | 1 | 3 | 0.0 | ||||||||||||||
| 6.50~7.00 | 1 | 1 | 2 | 0.0 | |||||||||||||||
| 6.00~6.50 | 6 | 6 | 0.1 | ||||||||||||||||
| 5.50~6.00 | 2 | 2 | 3 | 7 | 0.1 | ||||||||||||||
| 5.00~5.50 | 1 | 1 | 7 | 6 | 2 | 17 | 0.2 | ||||||||||||
| 4.50~5.00 | 1 | 2 | 7 | 8 | 1 | 19 | 0.2 | ||||||||||||
| 4.00~4.50 | 1 | 4 | 2 | 12 | 9 | 3 | 31 | 0.4 | |||||||||||
| 3.50~4.00 | 1 | 23 | 26 | 21 | 5 | 11 | 4 | 91 | 1.0 | ||||||||||
| 3.00~3.50 | 14 | 46 | 35 | 34 | 15 | 2 | 3 | 3 | 152 | 1.7 | |||||||||
| 2.50~3.00 | 8 | 76 | 84 | 99 | 48 | 19 | 7 | 5 | 4 | 1 | 351 | 4.0 | |||||||
| 2.00~2.50 | 1 | 79 | 252 | 238 | 181 | 101 | 44 | 35 | 12 | 6 | 6 | 3 | 958 | 10.9 | |||||
| 1.75~2.00 | 145 | 210 | 191 | 138 | 78 | 28 | 14 | 1 | 1 | 4 | 810 | 9.2 | |||||||
| 1.50~1.75 | 14 | 233 | 284 | 255 | 177 | 94 | 29 | 10 | 4 | 1100 | 12.5 | ||||||||
| 1.25~1.50 | 24 | 346 | 450 | 399 | 198 | 94 | 32 | 11 | 1 | 1 | 1556 | 17.7 | |||||||
| 1.00~1.25 | 46 | 310 | 624 | 610 | 186 | 21 | 16 | 2 | 1815 | 20.7 | |||||||||
| 0.75~1.00 | 38 | 231 | 620 | 501 | 132 | 31 | 5 | 1558 | 17.8 | ||||||||||
| 0.50~0.75 | 6 | 43 | 103 | 103 | 26 | 1 | 282 | 3.2 | |||||||||||
| 0.25~0.50 | 3 | 7 | 10 | 0.1 | |||||||||||||||
| ~0.25 | 0 | 0.0 | |||||||||||||||||
| appearance frequency | 0 | 0 | 0 | 0 | 132 | 1402 | 2634 | 2451 | 1204 | 530 | 227 | 119 | 42 | 13 | 9 | 7 | 0 | 8770 | 100.0 |
| Frequency distribution[%] | 0.0 | 0.0 | 0.0 | 0.0 | 1.5 | 16.0 | 30.0 | 27.9 | 13.7 | 6.0 | 2.6 | 1.4 | 0.5 | 0.1 | 0.1 | 0.1 | 0.0 | 100.0 |
Table 3 Joint probability distribution of wave height and wave period(2017)
| 0.0~ | 1.0~ | 2.0~ | 3.0~ | 4.0~ | 5.0~ | 6.0~ | 7.0~ | 8.0~ | 9.0~ | 10.0~ | 11.0~ | 12.0~ | 13.0~ | 14.0~ | 15.0~ | 16.0~ | appearance frequency |
Frequency distribution [%] |
|
| 10.00~ | 0 | 0.0 | |||||||||||||||||
| 9.50~10.00 | 0 | 0.0 | |||||||||||||||||
| 9.00~9.50 | 0 | 0.0 | |||||||||||||||||
| 8.50~9.00 | 0 | 0.0 | |||||||||||||||||
| 8.00~8.50 | 0 | 0.0 | |||||||||||||||||
| 7.50~8.00 | 0 | 0.0 | |||||||||||||||||
| 7.00~7.50 | 0 | 0.0 | |||||||||||||||||
| 6.50~7.00 | 1 | 1 | 0.0 | ||||||||||||||||
| 6.00~6.50 | 2 | 2 | 4 | 0.0 | |||||||||||||||
| 5.50~6.00 | 4 | 1 | 4 | 4 | 13 | 0.1 | |||||||||||||
| 5.00~5.50 | 1 | 13 | 5 | 3 | 22 | 0.3 | |||||||||||||
| 4.50~5.00 | 2 | 4 | 9 | 13 | 3 | 2 | 33 | 0.4 | |||||||||||
| 4.00~4.50 | 7 | 5 | 19 | 16 | 8 | 2 | 57 | 0.7 | |||||||||||
| 3.50~4.00 | 22 | 50 | 25 | 23 | 12 | 1 | 133 | 1.5 | |||||||||||
| 3.00~3.50 | 6 | 53 | 78 | 69 | 32 | 13 | 6 | 257 | 2.9 | ||||||||||
| 2.50~3.00 | 1 | 48 | 86 | 80 | 65 | 40 | 24 | 2 | 346 | 4.0 | |||||||||
| 2.00~2.50 | 50 | 214 | 172 | 106 | 89 | 67 | 51 | 2 | 1 | 2 | 1 | 755 | 8.6 | ||||||
| 1.75~2.00 | 87 | 204 | 141 | 154 | 102 | 43 | 19 | 4 | 2 | 2 | 758 | 8.7 | |||||||
| 1.50~1.75 | 12 | 145 | 275 | 257 | 183 | 128 | 75 | 12 | 8 | 5 | 1100 | 12.6 | |||||||
| 1.25~1.50 | 21 | 228 | 354 | 477 | 337 | 179 | 61 | 25 | 3 | 1685 | 19.2 | ||||||||
| 1.00~1.25 | 54 | 342 | 510 | 490 | 274 | 138 | 38 | 6 | 3 | 1855 | 21.2 | ||||||||
| 0.75~1.00 | 28 | 180 | 493 | 358 | 157 | 67 | 5 | 1288 | 14.7 | ||||||||||
| 0.50~0.75 | 3 | 32 | 183 | 138 | 54 | 33 | 8 | 451 | 5.1 | ||||||||||
| 0.25~0.50 | 0 | 0.0 | |||||||||||||||||
| ~0.25 | 0 | 0.0 | |||||||||||||||||
| appearance frequency | 0 | 0 | 0 | 0 | 118 | 1065 | 2287 | 2203 | 1483 | 940 | 427 | 183 | 39 | 8 | 4 | 1 | 0 | 8758 | 100.0 |
| Frequency distribution[%] | 0.0 | 0.0 | 0.0 | 0.0 | 1.3 | 12.2 | 26.1 | 25.2 | 16.9 | 10.7 | 4.9 | 2.1 | 0.4 | 0.1 | 0.0 | 0.0 | 0.0 | 100.0 |
Comment
The frequency of significant wave height between 0.75m and 1.50m and significant wave period between 8 sec and 9 sec have maximum occurrence frequency in 2015. The significant wave height between 0.75m and 1.25 m and the significant period between 6 sec. and 7 sec have maximum occurrence frequency in 2016 and 2017.
5:Monthly mean significant wave height and data availability
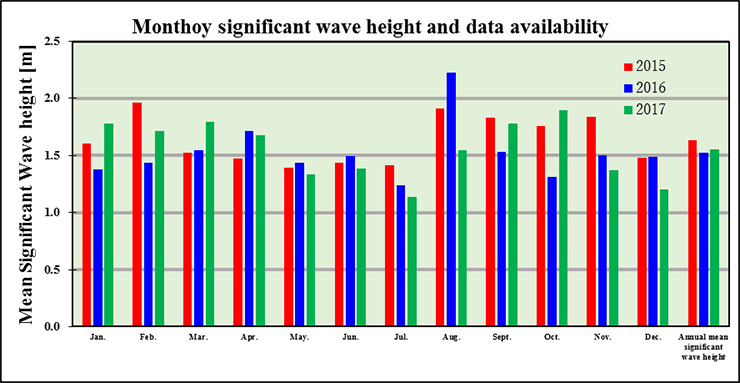
| Description | Year | Jan. | Feb. | Mar. | Apr. | May. | Jun. | Jul. | Aug. | Sept. | Oct. | Nov. | Dec. | Annual mean significant wave height |
|---|---|---|---|---|---|---|---|---|---|---|---|---|---|---|
| Mean significant wave height(m) |
2015 | 1.60 | 1.96 | 1.53 | 1.48 | 1.39 | 1.43 | 1.41 | 1.91 | 1.83 | 1.76 | 1.84 | 1.48 | 1.63 |
| 2016 | 1.38 | 1.43 | 1.55 | 1.72 | 1.43 | 1.49 | 1.24 | 2.22 | 1.53 | 1.31 | 1.50 | 1.49 | 1.53 | |
| 2017 | 1.78 | 1.72 | 1.80 | 1.67 | 1.33 | 1.38 | 1.14 | 1.54 | 1.78 | 1.90 | 1.37 | 1.20 | 1.55 | |
| Data acquition rate(%) |
2015 | 100.0 | 100.0 | 100.0 | 100.0 | 100.0 | 100.0 | 100.0 | 100.0 | 100.0 | 100.0 | 100.0 | 100.0 | 100.0 |
| 2016 | 100.0 | 100.0 | 100.0 | 100.0 | 98.8 | 99.9 | 100.0 | 99.7 | 100.0 | 99.7 | 100.0 | 100.0 | 99.8 | |
| 2017 | 100.0 | 100.0 | 100.0 | 100.0 | 100.0 | 100.0 | 100.0 | 100.0 | 99.7 | 100.0 | 100.0 | 100.0 | 100.0 |
Monthly mean significant wave height and data availability
Comment
Monthly mean significant wave height is between 1.20m and 2.32m.
6:Monthly mean significant wave period and data availability
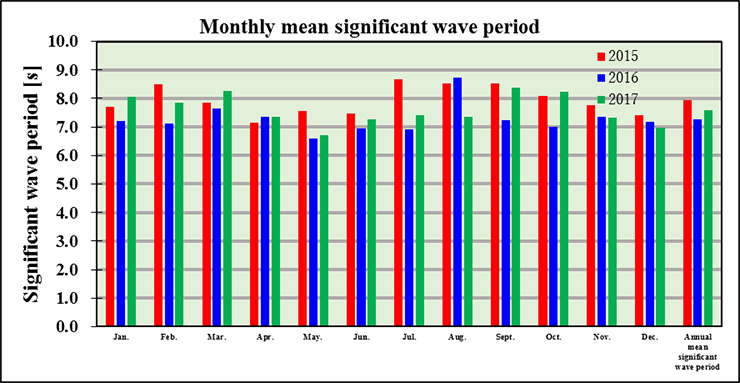
| Description | Year | Jan. | Feb. | Mar. | Apr. | May. | Jun. | Jul. | Aug. | Sept. | Oct. | Nov. | Dec. | Annual mean significant wave period |
|---|---|---|---|---|---|---|---|---|---|---|---|---|---|---|
| Mean significant wave period(s) |
2015 | 7.70 | 8.50 | 7.85 | 7.13 | 7.56 | 7.46 | 8.66 | 8.53 | 8.53 | 8.09 | 7.76 | 7.41 | 7.93 |
| 2016 | 7.22 | 7.13 | 7.66 | 7.35 | 6.58 | 6.95 | 6.92 | 8.73 | 7.23 | 6.99 | 7.35 | 7.18 | 7.28 | |
| 2017 | 8.05 | 7.84 | 8.27 | 7.34 | 6.70 | 7.28 | 7.40 | 7.35 | 8.38 | 8.22 | 7.33 | 6.97 | 7.59 | |
| Data availability rate(%) |
2015 | 100.0 | 100.0 | 100.0 | 100.0 | 100.0 | 100.0 | 100.0 | 100.0 | 100.0 | 100.0 | 100.0 | 100.0 | 100.0 |
| 2016 | 100.0 | 100.0 | 100.0 | 100.0 | 98.8 | 99.9 | 100.0 | 99.7 | 100.0 | 99.7 | 100.0 | 100.0 | 99.8 | |
| 2017 | 100.0 | 100.0 | 100.0 | 100.0 | 100.0 | 100.0 | 100.0 | 100.0 | 99.7 | 100.0 | 100.0 | 100.0 | 100.0 |
Monthly mean significant wave period and data availability
Comment
Monthly mean significant wave period is between 6.58 sec and 8.37 sec. Because of the strong swell from the Pacific Ocean, the significant wave period is long throughout the year.
3. Current Data (2015~2017)
1:Frequency distribution of current speed
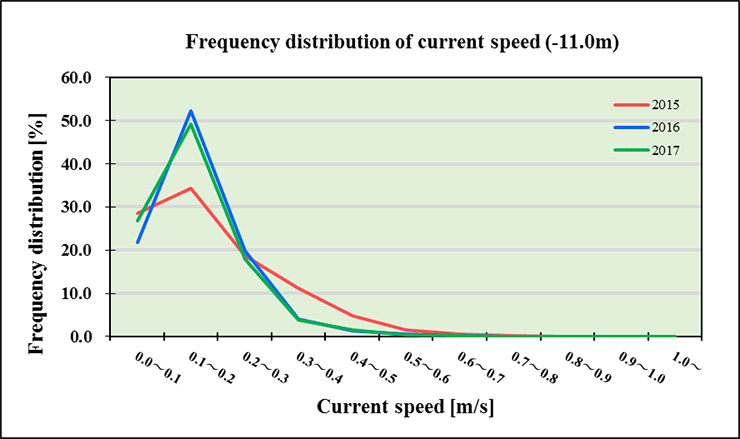
Comment
The maximum frequency distribution of current speed is within the range of the low flow velocity in 2016 and 2017, but in 2015 frequency for higher current speed is also significant which is different from the other years.
2:Current direction frequency distribution
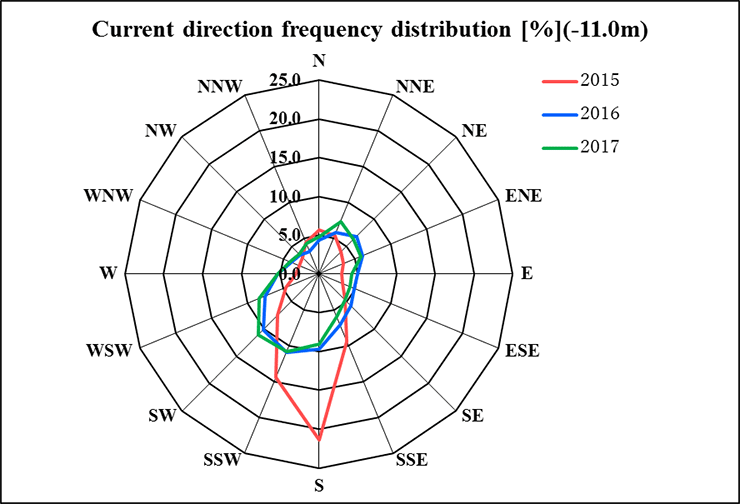
| Description | year | N | NNE | NE | ENE | E | ESE | SE | SSE | S | SSW | SW | WSW | W | WNW | NW | NNW |
|---|---|---|---|---|---|---|---|---|---|---|---|---|---|---|---|---|---|
| Current distribution[%] |
2015 | 5.7 | 5.3 | 4.0 | 3.5 | 3.0 | 3.3 | 4.7 | 9.4 | 21.4 | 14.4 | 7.5 | 4.7 | 2.9 | 2.7 | 3.1 | 4.4 |
| 2016 | 4.4 | 5.8 | 6.8 | 6.0 | 4.9 | 4.9 | 5.9 | 7.1 | 9.7 | 11.0 | 10.2 | 7.5 | 5.3 | 3.9 | 3.4 | 3.1 | |
| 2017 | 4.8 | 7.2 | 6.3 | 5.8 | 4.2 | 4.3 | 4.8 | 5.9 | 9.1 | 10.8 | 11.1 | 8.3 | 5.3 | 4.1 | 3.6 | 4.3 |
Current direction frequency distribution
Commentary
The Southbound current is dominant in 2015, while current direction in 2016 and 2017 are slightly spreaded.
3:Mean current speed profile
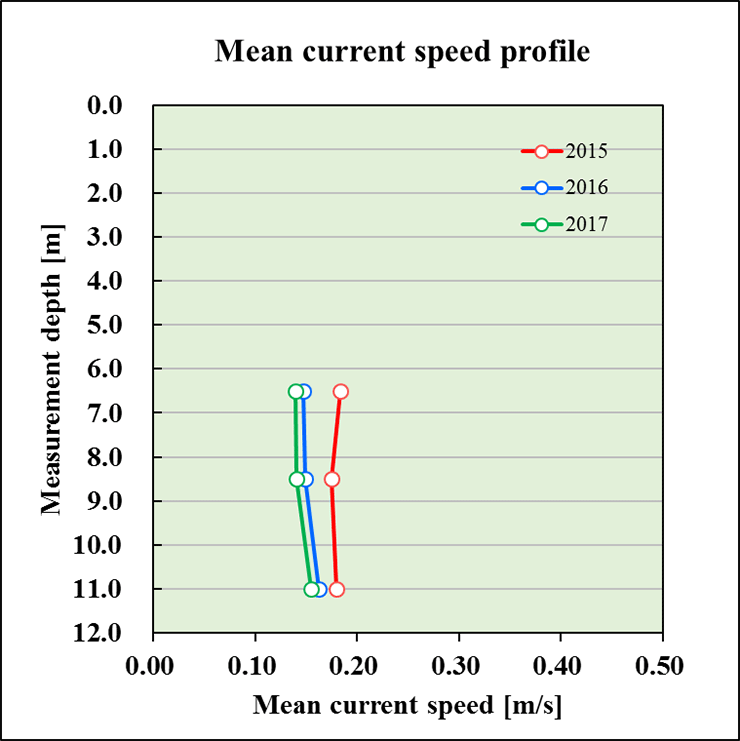
Comment
The mean current speed profile between 6.5 m and 11 m below the sea level shows little difference. The mean current speed between 6.5 m and 11 m below the sea level in 2015 is between 0.17 m/s and 0.18 m/s and those in 2016 and 2017 are between 0.15 m/s and 0.16 m/s, and the current speed in 2015 tends to be higher than those in other years.
4:Monthly mean current speed and data availability
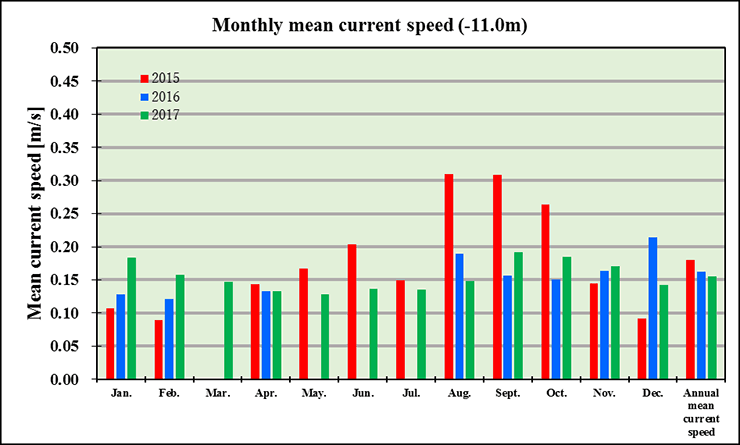
| Description | Observation water depth |
Year | Jan. | Feb. | Mar. | Apr. | May. | Jun. | Jul. | Aug. | Sept. | Oct. | Nov. | Dec. | Annual mean current speed |
|
|---|---|---|---|---|---|---|---|---|---|---|---|---|---|---|---|---|
| Current speed(m/s) | 11.0m | 2015 | 0.11 | 0.09 | 0.14 | 0.17 | 0.20 | 0.15 | 0.31 | 0.31 | 0.26 | 0.14 | 0.09 | 0.18 | ||
| 2016 | 0.13 | 0.12 | 0.19 | 0.16 | 0.15 | 0.16 | 0.21 | 0.16 | ||||||||
| 2017 | 0.18 | 0.16 | 0.15 | 0.13 | 0.13 | 0.14 | 0.14 | 0.15 | 0.19 | 0.18 | 0.17 | 0.14 | 0.15 | |||
| Data availability(%) | 2015 | 83.1 | 70.2 | 0.0 | 48.6 | 100.0 | 95.6 | 100.0 | 100.0 | 100.0 | 100.0 | 99.3 | 100.0 | 83.1 | ||
| 2016 | 100.0 | 61.2 | 5.0 | 11.4 | 0.0 | 0.0 | 0.0 | 92.2 | 100.0 | 100.0 | 100.0 | 98.8 | 55.7 | |||
| 2017 | 100.0 | 90.3 | 100.0 | 100.0 | 100.0 | 100.0 | 100.0 | 100.0 | 100.0 | 100.0 | 90.0 | 100.0 | 98.4 | |||
Monthly mean current speed (-11m) and data availability
Comment
The current speed from August to October 2015 is about twice higher than in 2016, and the current speed in December 2016 is about twice higher than that in December 2015. In August 2015 the Kuroshio current going up north was suppressed and the Southbound current is dominant. However in December 2016 the Kuroshio current going up north was not suppressed and the North-Eastbound current off the coast of Fukushima is dominant.


